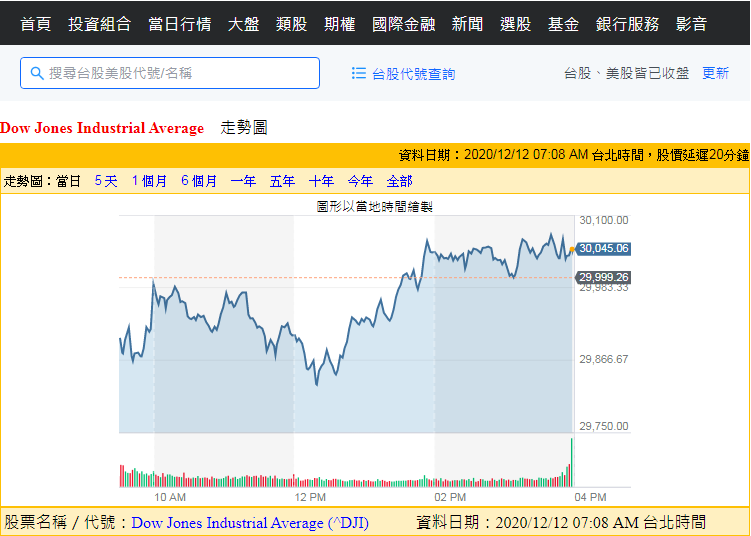
如果大家有在觀測或分析趨勢,會看到有些網頁會以圖表的方式來呈現資料,透過使用者將滑鼠移上去後,顯示每個點的數據,來提升可讀性及使用體驗,這時候,如果想要利用Python網頁爬蟲來爬取圖表上的數據,進行客製化的分析,該如何達成呢?
本文將以Yahoo奇摩股市的「美股大盤行情圖表」為例,帶大家了解網頁圖表的顯示原理,並且該如何利用這樣的原理,讓Python網頁爬蟲能夠取得資料。
其中的實作重點包含:- 安裝套件
- 網頁圖表分析
- 爬取圖表資料
- 整合Pandas顯示爬取資料
一、安裝套件
首先,利用以下的指令來安裝爬取網頁圖表所需的套件:
$ pip install requests

$ pip install pandas
其中,requests套件用來發送請求,而pandas套件則是用來存放及顯示Python網頁爬蟲所取得的圖表資料,提升可讀性與分析效率。
二、網頁圖表分析
接下來,前往Yahoo奇摩股市的首頁,可以看到台股、亞股、歐股及美股等大盤行情的圖表,以美股的圖表為例,如下圖:
為了分析網頁圖表是透過哪一個請求(Request)來取得資料,可以在圖表的地方點擊滑鼠右鍵,選擇「檢查」,並且切換到「Network」的頁籤,如下圖:
接著,按下鍵盤的Ctrl+R重新整理網頁,就可以看到網頁背後的請求(Request)狀況,如下圖:而完整的網址,可以在「Headers(表頭)」的頁籤中看到,如下圖:
三、爬取圖表資料
網頁圖表分析完成後,在桌面建立一個chart_scraper.py檔案,並且引用如下圖的模組(Module):
import requests
import datetime
import pandas as pd
接下來,利用requests模組(Module)發送請求到圖表資料的網址,如下範例:
import requests
import datetime
import pandas as pd


url = "https://partner-query.finance.yahoo.com/v8/finance/chart/%5EDJI?range=1d&comparisons=undefined&includePrePost=false&interval=2m&corsDomain=tw.stock.yahoo.com&.tsrc=yahoo-tw"
response = requests.get(url)
取得了網址所回傳的Json格式資料後,可以使用json()方法(Method)轉換為字典(Dictionary)的資料型態,來進行「美股指數」、「成交量」及「時間戳記」的數據爬取,如下範例:
import requests
import datetime
import pandas as pd


url = "https://partner-query.finance.yahoo.com/v8/finance/chart/%5EDJI?range=1d&comparisons=undefined&includePrePost=false&interval=2m&corsDomain=tw.stock.yahoo.com&.tsrc=yahoo-tw"
response = requests.get(url)

close = response.json()["chart"]["result"][0]["indicators"]["quote"][0]["close"] #美股指數
volume = response.json()["chart"]["result"][0]["indicators"]["quote"][0]["volume"]  #成交量

tw_time = []  #存放日期格式的台灣時間
timestamps = response.json()["chart"]["result"][0]["timestamp"]
for index in range(len(timestamps)):
tw_time.append(datetime.datetime.utcfromtimestamp(timestamps[index]-18000)) #將時間戳記轉為台灣時間以上範例中的「美股指數」及「成交量」,大家可以根據Json格式的階層來進行爬取即可,而「時間戳記」的部分,並非日期時間格式,所以需要額外進行轉換的動作。
在第12行先自訂一個tw_time串列(List),用來存放等一下「時間戳記」轉換為日期時間格式後的資料。接著,在第13行取得Json格式所有的「時間戳記」後,透過迴圈及datetime模組(Module),將每一個「時間戳記」轉為日期時間格式,除此之外,由於「時間戳記」是「EST」時區的資料,所以在第15行需減18000,才是台灣的GMT時區資料,從圖表的HTML原始碼可以得知,如下圖:
四、整合Pandas顯示爬取資料
Python網頁爬蟲取得所需的圖表資料後,接下來,本文將使用Pandas DataFrame來進行呈現,首先,將取得的「美股指數」、「成交量」及「時間」資料打包為字典(Dictionary),如下範例:
import requests
import datetime
import pandas as pd


url = "https://partner-query.finance.yahoo.com/v8/finance/chart/%5EDJI?range=1d&comparisons=undefined&includePrePost=false&interval=2m&corsDomain=tw.stock.yahoo.com&.tsrc=yahoo-tw"
response = requests.get(url)

close = response.json()["chart"]["result"][0]["indicators"]["quote"][0]["close"] #美股指數
volume = response.json()["chart"]["result"][0]["indicators"]["quote"][0]["volume"]  #成交量

tw_time = []
timestamps = response.json()["chart"]["result"][0]["timestamp"]
for index in range(len(timestamps)):
    tw_time.append(datetime.datetime.utcfromtimestamp(timestamps[index]-18000)) #台灣時間

data = {
    "tw_time": tw_time,
    "close": close,
    "volumn": volume
}
最後,傳入Pandas DataFrame類別,即可以表格的方式來呈現網頁圖表的資料,如下範例:
import requests
import datetime
import pandas as pd


url = "https://partner-query.finance.yahoo.com/v8/finance/chart/%5EDJI?range=1d&comparisons=undefined&includePrePost=false&interval=2m&corsDomain=tw.stock.yahoo.com&.tsrc=yahoo-tw"
response = requests.get(url)

close = response.json()["chart"]["result"][0]["indicators"]["quote"][0]["close"] #美股指數
volume = response.json()["chart"]["result"][0]["indicators"]["quote"][0]["volume"]  #成交量

tw_time = []
timestamps = response.json()["chart"]["result"][0]["timestamp"]
for index in range(len(timestamps)):
    tw_time.append(datetime.datetime.utcfromtimestamp(timestamps[index]-18000)) #台灣時間

data = {
    "tw_time": tw_time,
    "close": close,
    "volumn": volume
}

df = pd.DataFrame(data)
print(df)
執行結果
五、小結
在許多的分析類型網頁中,有時提供的圖表,並不一定會附上詳細的資料,這時候就可以利用本文所分享的技巧,觀察網頁圖表的資料來源網址,使用Python網頁爬蟲來取得圖表上每一個點的數據,進行更多元的分析應用,來符合自身的需求。大家是否也有爬取網頁圖表的經驗呢?又是使用什麼方法或技巧來取得其中的資料?歡迎在底下留言和我分享唷 :)
如果您喜歡我的文章,請幫我按五下Like(使用Google或Facebook帳號免費註冊),支持我創作教學文章,回饋由LikeCoin基金會出資,完全不會花到錢,感謝大家。


留言
張貼留言